
In preparation for my (hopeful) DynamicsCon nomination, I’m starting a blog series about concepts and tips I wish I’d understood better when I started working with Power BI – aptly titled “Power BI Concepts I Wish I Knew When I Started”. If you’d like to see this written content made available via a live presentation and YouTube, please vote for my DynamicsCon idea!
My God It’s Full Of Stars
There’s an important database modeling concept in Power BI referred to as a “Star Schema” data model. Microsoft has an excellent Docs article explaining the details of this structure, which you should definitely read the first half of.
Here’s the article summary had you clicked on it – use a Star Schema data model design; if you can’t create a very simple diagram of your data model then it’s probably not a Star Schema. The built-in tools in Power BI do not display this concept in an intuitive way, so I diagram models in a Word or Excel table. An example of a Star Schema model is displayed below.
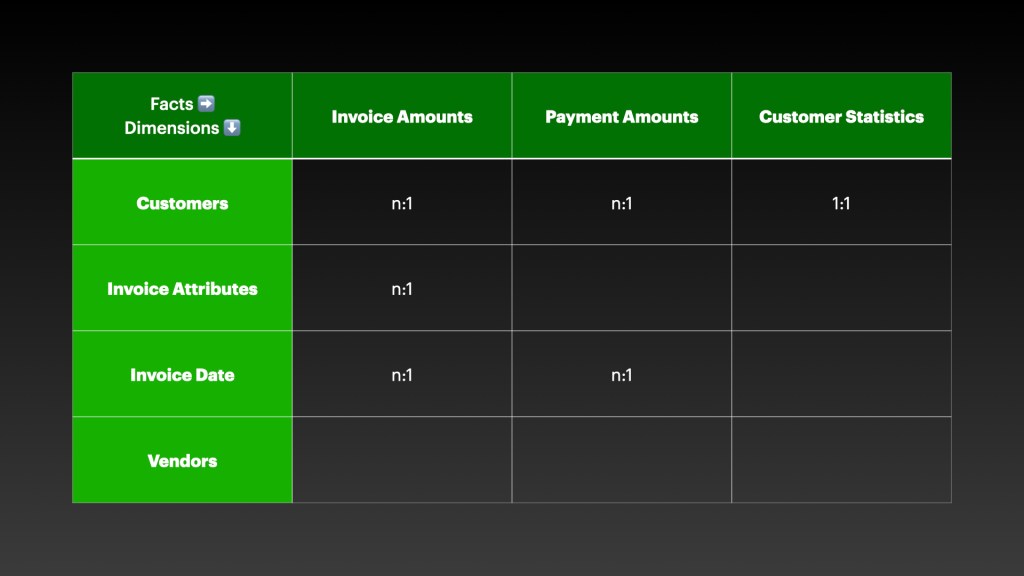
In this diagram there are Facts, Dimensions, and Relationships. In Power BI, Facts and Dimensions are both tables represented in the model – brought in through Get Data. Relationships are defined and managed in the creatively named Manage Relationships form.
- Facts – Transactional tables containing numbers (e.g. Invoice amount, Payment amount)
- Dimensions – Attribute tables containing Text and Grouping fields (e.g. Customer name, Customer type)
- Relationships – The field that cross references the Fact and Dimension (e.g. Customers and Invoices relate by Customer Id, and there are many Invoices for one Customer)
Ok, But Why
The concept of a Star Schema is fairly simple, but the “why” is a bit more complex. My favorite answer is “if you’re not sure why you should use a Star Schema, then you must use a Star Schema.” Star Schema is the default answer unless you understand an objectively better path.
In CRM and Finance databases, which are often the source of BI data, information is stored in Normalized tables. Normalized tables in databases basically mean every piece of information is only stored once – an intuitive goal for performance and data accuracy reasons. In Power BI the goal of representing data is different – every piece of information is surfaced in a way that makes it simpler to perform calculations and filtering. A Star Schema model is the simplest type of model to achieve this result.
Many power users are familiar with making data models simpler through their experience in Excel. Have you ever downloaded a transactional table to Excel, then did a VLOOKUP (try XLOOKUP) on an Id column so you can return a Description field to your PivotTable? Congratulations, you already understand denormalization! Power BI called and said, “I have a more efficient way to do your VLOOKUP using Relationships.”
Ok, But My Data Cannot Have Relationships Defined Like Your Simplistic Diagram Because It’s From A Normalized Database Designed By Someone Who Was Apparently Smoking The Grass At The Time
Welcome to Power BI!
Molding normalized data is like molding clay while learning pottery. You need to throw the clay in the kiln a few times and watch it explode. Eventually, out of the kiln will come an “interesting” bowl you gift to your mum and she puts it prominently in the back of a drawer. Pretty soon you’re firing mugs and vases. After that – give up on pottery, read a Power BI blog or two, and your data model will be far better than my metaphors!

There are instances in Power BI where the structure of data needs to be manipulated to conform to a Star Schema design. In the Star Schema table shown above , there are sample tables of Customers (dimension) and Customer Statistics (fact). In the source system, the “Customer Name” and “Customer Average Days To Pay” data points might be stored in a single table. To conform to a Star Schema in Power BI, the single table would be duplicated and one instance of the table represented as a Dimension and the other instance represented as a Fact.
There are many other types of manipulations on normalized source data – the purpose of a Star Schema is for the concept to be the guiding light and to avoid accidental complexity. Conceptualize and work towards a solid structure for the Power BI data model and report writing will be greatly simplified.
Ok, But Why Do The Numbers In My Report Keep Repeating
If you find yourself looking at a table like the one below with repeating values, it has to do with the structure of the data model. Fact tables need to have a common relationship with Dimensions to be displayed side by side. Customer Statistics has no Relation to Invoice Attributes, and the two cannot live in harmony.
| Invoice Attributes.Invoice # | Invoice Amounts.Invoice Total | Customer Statistics.Average Days To Pay |
| IN1000 | $5,500 | 999 |
| IN1001 | $4,200 | 999 |
| IN1002 | $3,400 | 999 |
When reporting across multiple Fact tables, repeating values are caused by a missing Relationship or a Relationship that cannot be defined. Getting the right answer may be a matter of getting more detailed source data, creating a Calculated Measure, or it may never be a valid scenario and the structure of the report needs updated.
Ok.
I learned about Star Schema data modeling early in my Power BI journey. The more challenging lesson for me was to filter out a lot of superfluous noise when it comes to Data Modeling. Even the Microsoft Docs article referenced earlier about Star Schema design delves into some obscure topics. A focus on denormalizing and relating data can be sufficient to make considerable progress in Power BI.
How did you learn the process of data modeling? Should I take up pottery? Comment below, and please click the Subscribe button to get this blog series in your Inbox.
Check out my other posts in the “Power BI Concepts I Wish I Knew When I Started” series:
OneDrive > GitHub
Separate Data Models And Reports
Make It Pretty

Is there an easy way to distribute a small data model full of dummy data, like the relations from your example, so that people following along can through their own pot? Fire the data? Some other mixed metaphor?
LikeLike
It would be nice to have an end to end .pbix file for the entire series! I’ll think about what I can do – it relates to some other ideas I have. Great suggestion.
LikeLike