Presenter: Dan Edwards
Auto Date Fields
Power BI can create automatic date hierarchies, for report and drill down by Year/Quarter/Month/Day. It’s important to consider whether your data model has more than one fact table with a date attribute. If there are multiple facts, or you have already created a date table, it’s a better to use your own date dimension.
“Don’t use auto date/time” -Dan
I love these types of tips and tricks – here’s how it works, and don’t do it!
Creating a Date Table with DAX
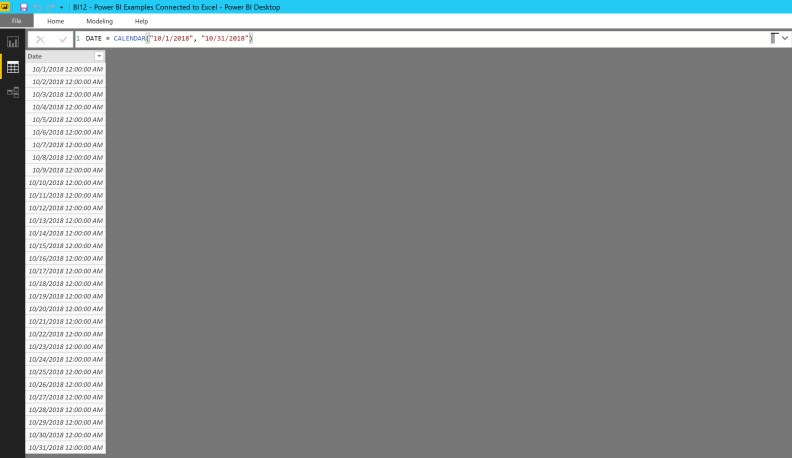
It’s possible to use a DAX expression to create a date table. The initial DAX expression looks like this:
Date = CALENDAR(“1/1/2016”, “12/31/2019”)
Use the DAX expression to create a New table in Power BI.
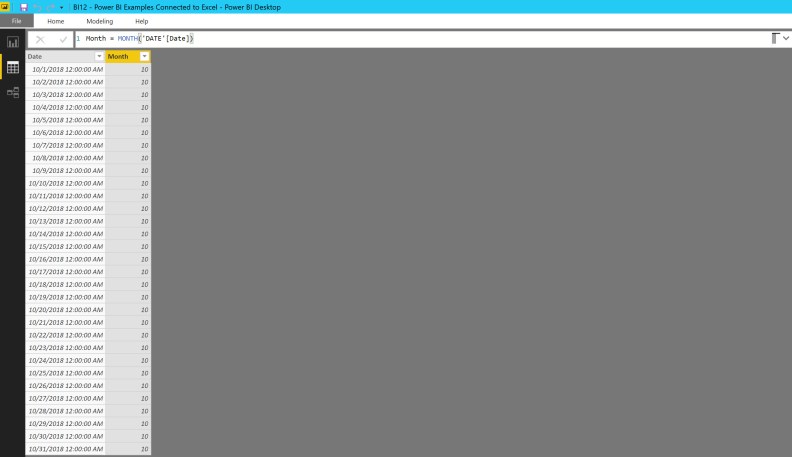
Then additional columns can be added to the Date dimension table:
Month = MONTH(‘DATE'[Date])
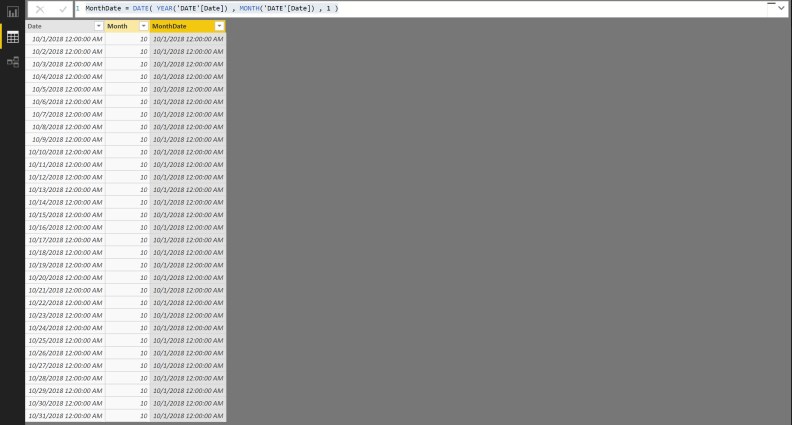
It’s also possible to do concepts like MonthDate where you calculate a Date column with the first day of every month, which can provide flexibility.
MonthDate = DATE( YEAR(‘DATE'[Date]) , MONTH(‘DATE'[Date]) , 1 )
Using an Effective Date
One of the scenarios is a scenario where the user wants to pick the effective date – for example a cutoff date or the last 12 months.
Dan mentioned he has a fairly extensive blog post on how to implement this concept.
Great presentation!
